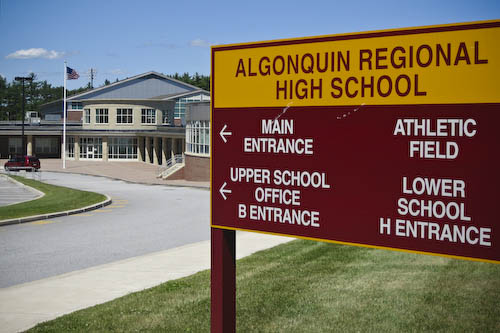
Above: My impression is that ARHS fall from the Newsweek list has less to do with the school than with the magazine’s methodology. (Photo by Susan Fitzgerald)
Back in 2013, the blog shared news that Newsweek ranked Algonquin Regional High School among its top 500 high schools in the nation.
It looks like I missed reporting the 2014 rankings last year.The 2015 rankings were released today, prompting me to look back at 2014 as well. ARHS didn’t make either list.
So, why did our high school drop off? Did our standards lapse?
It doesn’t appear so. From comparing the rankings, it looks like a changes in methodology are more likely the root.
Already, ARHS was close to the bottom of the 500 list, at 443. That ranking was based on an evaluation done by Newsweek in collaboration with “The Daily Beast”.
The criteria listed by Newsweek changed in 2014, and again for this year’s ranking. The new criteria seem much more complex.*
So what area towns did make the top 500? Shrewsbury was 128 this year, up 20 from last year.
Hopkinton is at 93 this year. Interestingly, the school beat us in 2013, but failed to make the 2014 rankings. And Natick High made this year’s list at 448.
Here are the rankings for our state:
16 Dover-Sherborn Regional High
52 Medfield Senior High
54 Weston High
67 Newton North High
75 Westwood High
93 Hopkinton High
115 Hingham High
128 Shrewsbury Sr. High
139 Groton Dunstable Regional
207 Longmeadow High
253 Newburyport High
278 Georgetown High School
315 Arlington High
381 King Philip Regional High
396 Marblehead High
424 Ashland High
448 Natick High
451 Braintree High
For the full article, click here.
*The Daily Beast listed the 2013 criteria as:
- Percent of graduates who were accepted to college (25%)
- Four-year, on-time graduation rate (25%)
- AP/IB/AICE tests per student (25%)
- Average SAT and/or ACT score (10%)
- Average AP/IB/AICE exam score (10%)
- Percent of students enrolled in at least one AP/IB/AICE course (5%)
In the new rankings with research partner Westat, 17.5% of the score is based on “Weighted AP/IB/Dual Enrollment composite” defined as:
((zAP*# of students)+(zIB * # of students)+( zLog(Dual Enrollment) * # of students))/(# of students taking the AP+ # of students taking the IB+#of students earning Dual Credits)
The other criteria are:
- College Enrollment Rate (25%)
- Graduation Rate (20%)
- Weighted SAT/ACT composite (17.5%)
- Student Retention (change in student enrollment between 9th and 12th grades; this measure is intended to control for dropout rates) (10%)
- Counselor-to-Student Ratio (10%)


Interesting to see the calculation. Really makes you realize that the numbers are a fairly rough estimate as best. You can get a few extra students who max out their AP class load one year bump up the ranking, only to see it drop once they graduate.
I know the magazine needs to release a new rating every year, but it seems like a much better way to rate the schools would be to calculate a trailing average of these figures over 5 years or so, smoothing out the numbers. For example, did Hopkinton really have enough school quality related changes to go from #257, to off the list, then back up to 93 this year? I would guess that it was an equally good school in all three years, but normal churn in the numbers caused the rankings to bounce around quite a bit.