
Above: Did Southborough students fare as well on their standardized tests as you hoped? (Photo posted to Flickr by by albertogp123)
The Massachusetts Department of Education has released the results of the MCAS tests from spring 2015. The Boston Business Journal shows Algonquin tying with three others for 25th highest out of 291 public high schools.
If you look at the BBJ’s slideshow of the “top 25”, it shows Wayland in the last spot. But under their complete ranking list, the journal ranks Wayland as tying with Northboro-Southboro, Needham, and Southern Berkshire for 25. (The ranking didn’t include vocational schools, but did include charter programs.)
What about grades 3-8? How did we do?
It depends on your perspective. As always, I’m sure some will be pleased and others disappointed.
There’s a lot of data available on the MassDOE website. Still, there were a few numbers that jumped out at me.
But first – this is a good time to remind you that the district is holding a workshop to go over the scores and what they mean. That’s on November 9th, 6:00 pm at Melican School in Northborough. (Click here for details.)
Now here are my highlights:
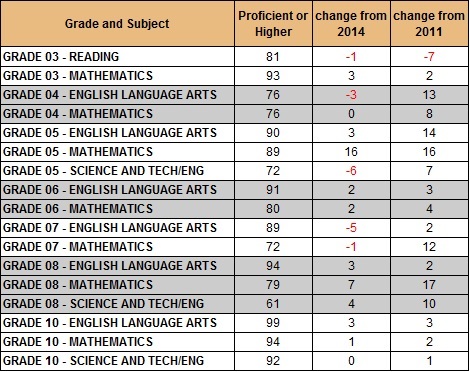
Third grade reading scores have slid down 7 points from 2011 and one from last year. (Though that’s still up 7 from 2011. And we tied with Hopkinton there while coming in 8 points higher than Northborough.)
All other scores have improved since 2011. And 5th grader’s math scores jumped up 16 points, while their science scores dropped by 6.
8th Grade science continues to be the lowest score at 61. Some readers have complained about that in the past. But looking at other schools, they seem to have the same issue. So that could be more about the test than the teaching. We scored the same as Shrewsbury, only two points lower than Hopkinton, and 11 higher than Ashland.
On the other hand, we were 9 points below Northborough. (I’d say our district’s 8th grade teachers should get together to figure that one out, but in November the state could be implementing a switch to PARCC!)
Below is the breakdown of proficient or higher scores by grade and subject. I included the change from last year and also from 2011 for a longer term look. (That’s as far back as the data I had access to.)
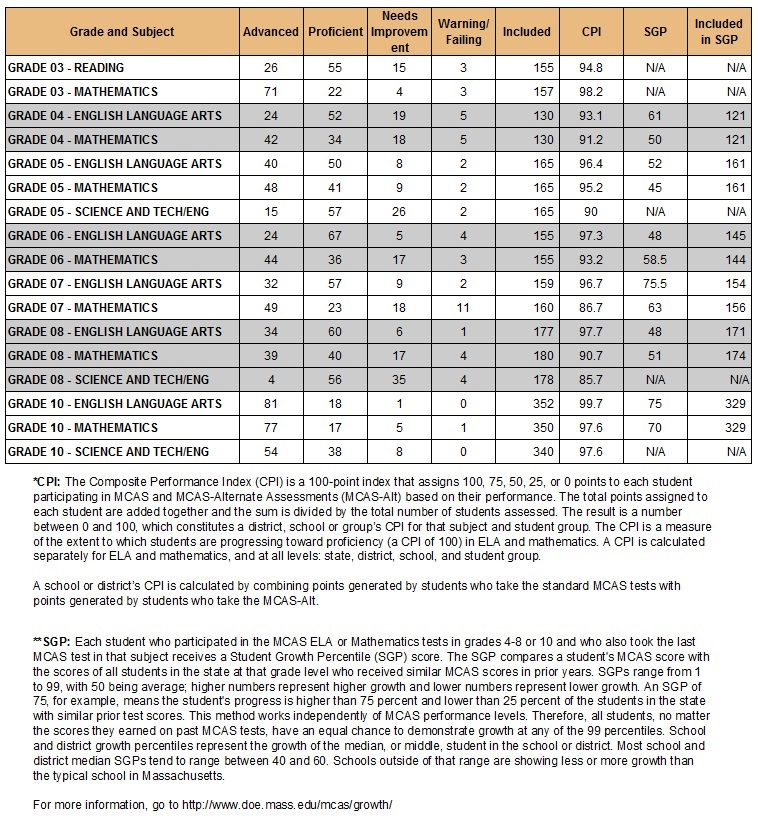
For a more detailed look at this year’s scores, click on the data table below to enlarge. (Enlarged version includes definitions for CPI and SGP.)
Unfortunately, I can’t give you a direct comparison of overall scores to surrounding school districts. Our neighbors’ overall scores are for Grades 3-10. Because of our regional high school, ours are split by 3-8 and then Algonquin alone. (And I don’t have time to compare each grade for all our neighbors!)
But if you’d like to take a better look at the statewide report and where we stand, click here.