
2020 school rankings have been posted on Niche.com. Algonquin and the Southborough district schools got high marks and some great rankings in the state and especially for the nation.
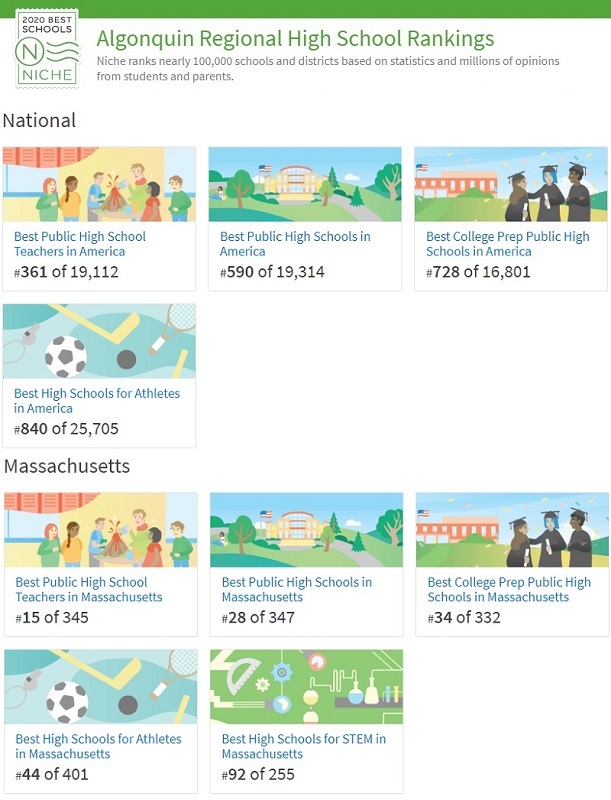
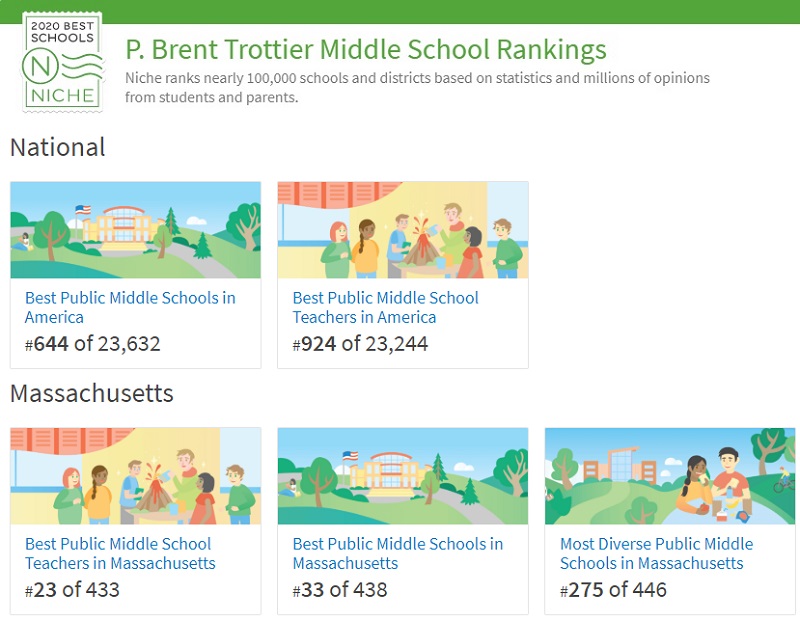
In national rankings, Algonquin Regional and Trottier were in the top 3% of public high schools and public middle schools, respectively.
It appears that Massachusetts did well overall in the rankings since both the high and middle school ranked at 8% for our state.
ARHS moved up one notch in the state since the “2019 list” released in 2018. Trottier improved by 11 spots. Woodward ranked in the top 5% of the state and Neary 6%. (There wasn’t a national ranking shown for the elementary schools.)
ARHS got an overall grade of A+ and Southborough schools for grades 2-8 got As.
While seeing our schools valued feels good, I always warn to take rankings with more than a grain of salt. The methodologies usually seem flawed.
In the case of Niche, some of the methodology factors in survey responses and reviews. In the case of Algonquin, it looks like some of the weighed-in responses were from 22-38 students and parents. But many of the factors are based on data like test scores, expenses, and absenteeism.
It seems surveys and reviews didn’t factor in to Southborough or most state elementary schools. (Most seemed to indicate “More opinions are needed” under poll results.) But some schools in the state were influenced by reviewer results.
The high school rankings were much more complex than the middle and elementary schools. High Schools were ranked based on grades in 10 categories, versus only three for the lower schools.
To see more detail on schools’ grades and rankings, click on the thumbnails below:
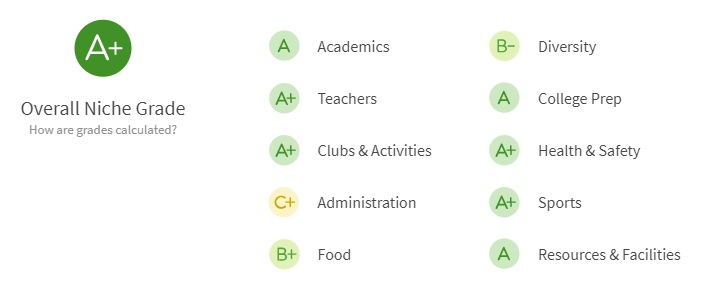

Since the C+ for Algonquin’s Administration stood out against the other high marks the school got, I wondered what the specific methodology for that was. It looks like Niche relies on survey responses for 50% of that grade. Another 20% is based on analysis of “academic and student life data” but also by reviews by students and parents. Only 30% is based on hard data. (You can see more details here.)
You may have noticed that I only shared above grades and rankings for Southborough schools starting with 2nd grade. That’s because Finn School (for grades preK-1) got a slightly lower score (A-) and wasn’t included in state rankings. It seems the difference between it and other Southborough schools was mainly lack of standardized test scores to judge.*
For full details on each school’s grades and ranks, click on the following Niche.com links: Algonquin, Trottier, and Southborough District (which includes links to the specific elementary schools).
*Students don’t take MCAS until the 3rd grade, after they graduate the lower school. Southborough elementary schools each got only a B or B+ for Diversity. The other Southborough schools were able to offset those with As for Academics and an A+ for Teachers. Finn’s Academics grade was left blank. It looks like that caused the diversity to have more weight on Finn’s grade than for the other two district elementary schools. Academics was also a factor in Teacher grades, which may have lowered Finn’s teacher gade (an A) vs other schools in our district, thereby pulling the school’s overall grade even lower. (Not that an A- is shabby.)