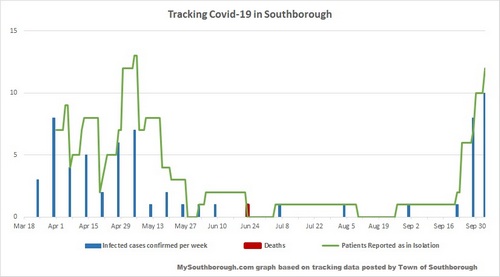
The number of Southborough residents diagnosed with Covid-19 is now up to 63. Twelve cases are active with those patients still in isolation.
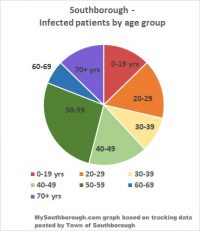
The updated figures show that seven more residents were diagnosed since last Thursday. Within the past two weeks, almost every age group has been impacted. (Only 60 year olds haven’t seen an increase in cases since May.)
Below are my updated charts based on the Town’s latest report. (Click to enlarge)
Updated (10/6/20 10:10 am): One more case was reported this morning, making it 11 this week. The graphs above aren’t updated with the new case, but I did replace the pie chart to fix a typo pointed out by a reader. (It had referred to patients under 20 as >19 instead of ≤19.)


Your pie chart indicates “>19 yrs”, which states, “greater than nineteen” when it is likely it should be showing “<19 yrs" indicating "less than nineteen". Since the next age group is "20-29", shouldn't the preceding age group include nineteen year olds? That would make this group "<=19 yrs" or "<20 yrs" which could be further simplified to "<20".
Maybe the first age group should read "0-19"?
Who's cutting the pumpkin pie at your house?
You are correct. I’ll fix the error.