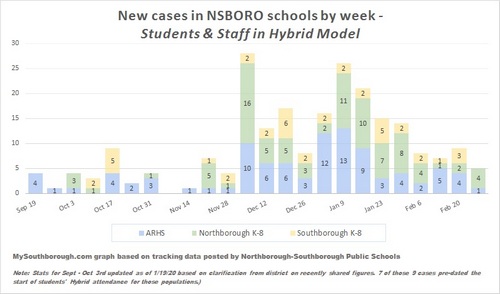
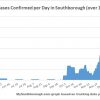
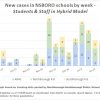
Above: Covid cases are down in NSBORO schools.
With the Town updating its figures today and the school administration publishing its weekly Dashboard last night, it’s time for a look a the numbers.
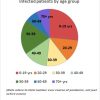
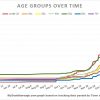
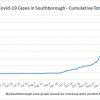
As of noon today, 402 residents have been confirmed as infected with Covid-19. 19 cases were confirmed in the prior 14 days, 6 of those in the prior 7 days. 41 cases are currently labeled active.
(For details, click on graphs above and right.)
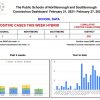
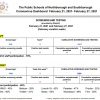
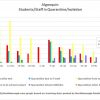
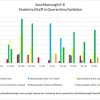
The Northborough-Southborough schools’ Dashboard for February 21 – 27th shows 5 cases were confirmed in the district, 226 over the course of the pandemic. Only one was an Algonquin student/staff member, none were from Southborough K-8 schools.
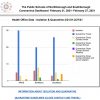
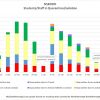
114 students/staff were isolated or quarantined last week. However, 2/3 of those were due to travel over February break the week prior.
The pooled screening program for students is growing with all ten schools involved and 40% enrollment.* (Hopefully, those figures will grow.) The program succeed in screening out 1 asymptomatic infected student last week. (A faculty/staff member was also screened positive.)
Below are charts and info from the latest Dashboard and my tracking of their data since the start of the school year.
*The public schools can’t require all students to participate in the screening program. Although, they can (and Algonquin does) require it in order to participate in in-person after school activities like Athletics and clubs.


Misleading headline followed by misleading language.
“Over 400 cases in Southborough”
“ As of noon today, 402 residents have been confirmed as infected with Covid-19”
No, there’s 41. 41 cases, there’s over 400 accumulative. Why does any sort of media/news reports these days strive to only spot light the negative and to make the headlines seem far worse than the current state of the pandemic. Instead of continuing to report how much higher the accumulative count is, let’s concentrate on the down slope of the spread. This country needs to see the light at the tunnel, no be reminded every darn day of the total number. It’s been a year so far, let’s start to report on how to end this.
Honestly, given the figures I’ve been keeping readers updated on all along, it never occurred to me that anyone would take that figure as active cases rather than cumulative.
I understand. I think as a society that has been dealing with this for a year now need to see more positive headlines. Lets not concentrate on the total numbers, let’s concentrate on the dwindling number of active cases. Give people hope for a normal life again.
I hear you. In the story you are commenting on, I chose to highlight a positive by spotlighting the District’s graph showing an overall decline in student/staff new cases across the three combined districts.
Although I share the number of active cases, I no longer focus on the figures since I discovered issues with the accuracy of that reporting by the Town in the past. Staffing issues led to some cases being listed as active longer than they actually were. That means that I can’t rely on the active case count necessarily being accurate at any given time.
In January, I wrote several stories where I highlighted declining new cases per 14 day period. However, more recently, those numbers haven’t continued to consistently decline. They are still down from early January, but higher than early October.
I have wondered how much of that is due to increased testing opportunities (like screening programs). But I didn’t track the state’s data on the number of tests per week for Southborough and the positivity rate. I am starting to look back at that but don’t know if I’ll be able to give it enough time to analyze data to share.