Above: There has been marked progress in getting Southborough residents vaccinated. (click to enlarge)
Last night, Mass Pubic Health released its weekly reports by Town. There was continued progress in Southborough’s population getting vaccinated.
With 16 cases in two weeks, our risk classification was kept at yellow. But looking at the Town’s data as of yesterday morning, there were only 9 cases confirmed in the prior 6 days and none since Monday.
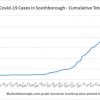
The Town’s cumulative total over the course of the pandemic remains at 499 cases. The number of active cases dropped from 46 to 35. (For details, click on graphs below.)
![]()
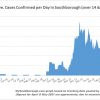
 The state lists our Average Daily Incidence Rate per 100,000 as 11.8 (lower than prior period) and the % of tests confirmed positive as 0.78% (<0.10% difference from prior report). Those figures are based on tests taken in the 14 days ending last Saturday. See my tracking of the testing & positivity rates right.
This week, the state lowered Northborough’s risk to low/green and kept all of our other immediate neighbors in yellow (Marlborough, Westborough, Hopkinton, Framingham, and Ashland). Circling one more level out, most of our secondary neighbors are low risk (green or gray) except for three yellow communities (Holliston, Hudson, and Milford).
As for vaccinations, as of this Tuesday 6,873 Southborough residents had received shots. That means 71% of our Town is at least partially vaccinated.
88% of residents 20+ are at least partially vaccinated. 65% of ages 50+ are fully vaccinated.
There is one area where progress hasn’t been shown in the past month. By April 6th, 88% of residents 75 years old and up were at least partially vaccinated. As of this week, 11% are still not documented* as having received vacccines.
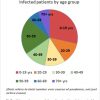
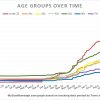
More highlights by age group and gender are in charts below:
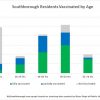
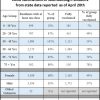
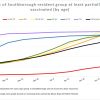
(For more details on those groups, plus race/ethnicity, click here.)

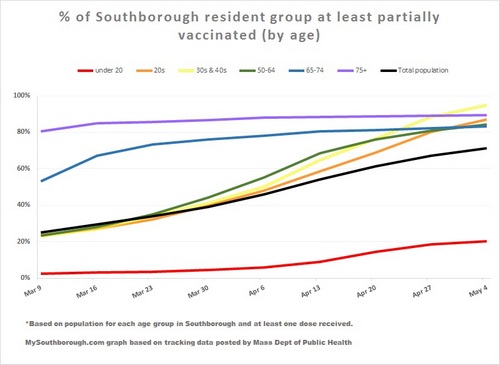

Breakdown by race/ethnicity may be of value to policy makers but a seemingly unnecessary and yet another potentially divisive factoid for the general public. We are in this together. Why get so granular?
It would seem pretty important for citizens to have the policy-making information, so that we can judge whether or not our public officials are engaging in the right sorts of outreach to demographics that aren’t getting vaccinated. Most groups in Southborough seem to be getting the shots. If we need to do any targeted public health outreach, it seems we need to reach out to white people, so if public officials propose outreach to African-Americans, we know that’s the wrong approach, even if it might be the right approach in the rural delta of Mississippi, where vaccine acceptance has been slow.