The state issued an updated report on Covid infections and vaccinations.
The state’s report on testing and infections last night kept the Town at the lowest risk level (grey) for the second straight week.
 The report listed 5 cases in two weeks based on tests taken through Saturday, May 22nd. The Average Daily Incidence Rate per 100,000 was 3.7 (lower than prior period) and the % of tests confirmed positive was 0.27% (also lower). (See graph right.)
Between May 18th and 25th, 281 residents received their first or only dose of the vaccine. 60% of them were 12-15 years old. In addition, 481 residents became fully vaccinated as of Tuesday.
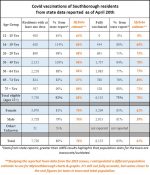
As I shared earlier this week, last week’s report highlighted that the population figures used by the state were lower than the actual population of teens in town. A reader reached out to me with population stats she extrapolated from the 2019 Census Data.* I took a look and crunched my own numbers. It appears to be a closer approximation to current teen age groups and total population in town.
 I added that estimated population data in my updated table (right), which also includes the state’s figures.
My new estimates have 76% of Southborough adults fully vaccinated and 88% of eligible age groups at least partially vaccinated. Those are a bit lower than the state’s figures have been indicating. (The state reports that 79% of adults fully vaccinated and 92% of eligible age groups at least partially vaccinated.)
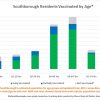
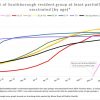
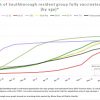
In my updated graphs tracking vaccination progress, I relied on my new population estimates rather than the state’s:
You can see the full details, plus race/ethnicity breakdowns here.
The new data takes care of age groups that had been reported as being over 100% vaccinated. As for the now larger stats for unvaccinated residents. . .
As I reported in a prior week, the data could be underestimating the number of some residents vaccinated. The Mass Dept of Public Health doesn’t get reports on residents vaccinated in other states. At the time, I referred mainly to Southborough seniors who may have gotten vaccinated as snowbirds in Florida this winter. The same could be true for college students returning home from out of state this summer.
*The 2019 Census Data for Southborough can be found on CensusReporter.org. (Thanks to Nicole Debonet for the tip.) To estimate, I shifted each age group to be two years older and calculated averages for groups split at different ages than in the vaccination report. It’s not meant to be an accurate representation, just a (hopefully) closer estimate.


