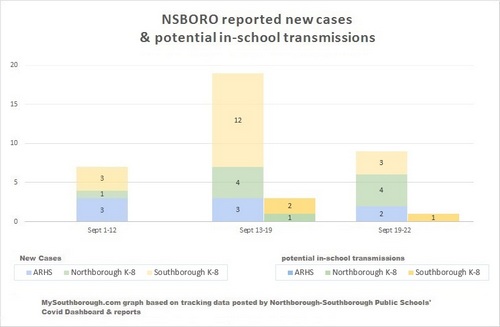
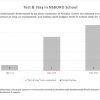
Above: NSBORO updated new cases and potential in-school transmissions this week. (click to enlarge)
This week, the schools and state published updated data on Covid cases and testing. So, I’m sharing an update. [Note: The Town’s data from the Board of Health is updated on Mondays.]
Mass Dept of Public Health reported 31 new cases in two weeks.* The % of tests confirmed positive was 1.68% (higher than prior report). The Average Daily Incidence Rate per 100,000 was 22.9 (higher than prior period). You can take a look at the testing trends and the prevalence of cases in our region below:
Yesterday, the Northborough-Southborough Public Schools posted an updated District Dashboard. It’s the second this week, since they are shifting to report on Thursdays.
9 new cases were reported in the prior 4 days (3 in Southborough K-8 classes and 2 in Algonquin).
From Sept 19-22, Test & Stay rapid tests identified 3 positive cases from asymptomatic close contacts. 1 new case of “potential in-school transmissions” brings the total to 4 so far this month, 3 of them at Southborough’s Finn School. Click on images below for more details:
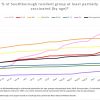
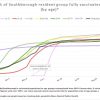
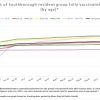
As of this week’s report – 8,601 Southborough residents had received shots (as of September 21st).
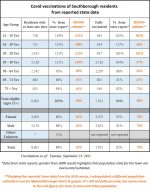 My data extrapolated from 2019 census reports indicates 90% of residents old enough to be eligible for shots are fully vaccinated, and another 8% are partially vaxxed. (I used census data since the state’s population data was clearly outdated.)
More highlights by age group and gender are in charts the chart above right and graphs below. (They include vaccination progress charts that zoom in on summer months.):
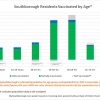
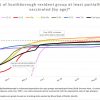
(For more details on those groups, plus race/ethnicity, click here.)
To find a clinic/location to recieve a Covid Vaccine click here. For Flu Vaccines, read about the Town’s Flu Clinic, here.
*The state’s report was based on tests taken in the 14 day period ending on the prior Saturday, September 18th.
**Population figures are just estimates. I use demographics extrapolated from 2019 census data since the state’s population data was clearly outdated.

