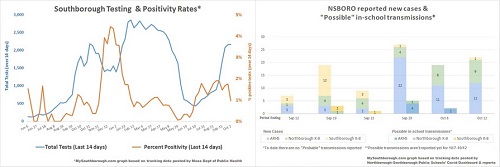
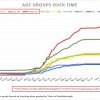
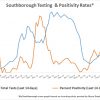
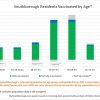
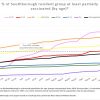
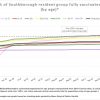
Above: A look at recent Covid data trends in Southborough and the schools. (graphs based on data reported by government and school officials)
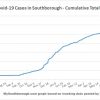
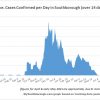
As of yesterday morning, the Southborough Board of Health is showing 6 residents in isolation for active cases of Covid-19. The total cases over the course of the pandemic is now 625. That’s 6 cases in eight days and 14 in two weeks.
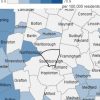
Last week’s report (issued October 7th)* indicated 19 cases in two weeks with the % of tests confirmed positive as 0.97%% (lower than prior report). The Average Daily Incidence Rate per 100,000 was 14.0 (lower than prior period).
For details, including a look at the Average Daily Incidence Rates in our region, click on thumbnails below:
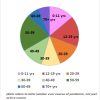
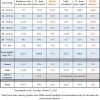
As of last week’s state report – 8,675 Southborough residents had received shots (as of October 5th).
I’m estimating 91% of residents old enough to be eligible for shots are fully vaccinated, and another 7% are partially vaxxed.* See details below:
(For more details on those groups, plus race/ethnicity, click here.)
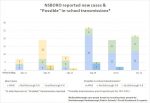 The most recent Northborough-Southborough Public Schools District Dashboard covered through Wednesday, October 6th. Since then, Daily Case Counts reported additional cases through October 12th.
Based on the reports, 22 new cases were confirmed over 6 days. One was in Southborough K-8. Twelve were from Algonquin (making it 23 cases in at the high school in the last two weeks.) Eight of the most recent cases required contact tracing, with contacts notified.
For the week ending Wednesday October 6th, no asymptomatic “Test and Stay” participants tested positive. 42 tests were given to students/staff who reported symptoms, resulting in 3 positive tests. The first week of pooled screening for asymptomatic students and staff screened out 1 case.
There were two new cases of “possible in-school transmissions” as of October 6th, but the district still hasn’t reported any “probable cases”.
Click on image above right for more details.
Reminder – Testing Sites and Vaccine Clinics:
- To find a clinic/location to recieve a Covid Vaccine (including second doses) click here.
- For information on Covid Booster shots, click here.
- For information on local drive thru testing, click here.
- For instructions to participate in the schools’ screening testing program for students, click here.
*The state’s report was based on tests taken in the 14 day period ending on the prior Saturday.
**Population figures are just estimates. I use demographics extrapolated from 2019 census data since the state’s population data was clearly outdated.
Updated (10/14/21 8:07 am): I corrected the color key for the regional map. (I discovered the state changes what the colors represent depending on the number of cases in a selected region each period.)

