
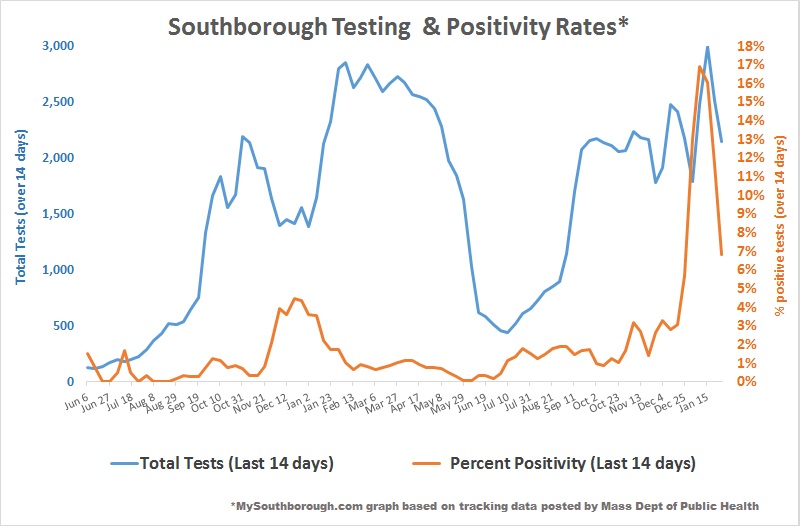
Above: The Positivity rates for Covid tests continue to decline. (click to enlarge)
[Updated 2/8/22 6:58 pm: The Town has since posted updated figures for February 8th, which is unusual. Between Monday morning and 1:00 pm today, there were 6 more cases reported.
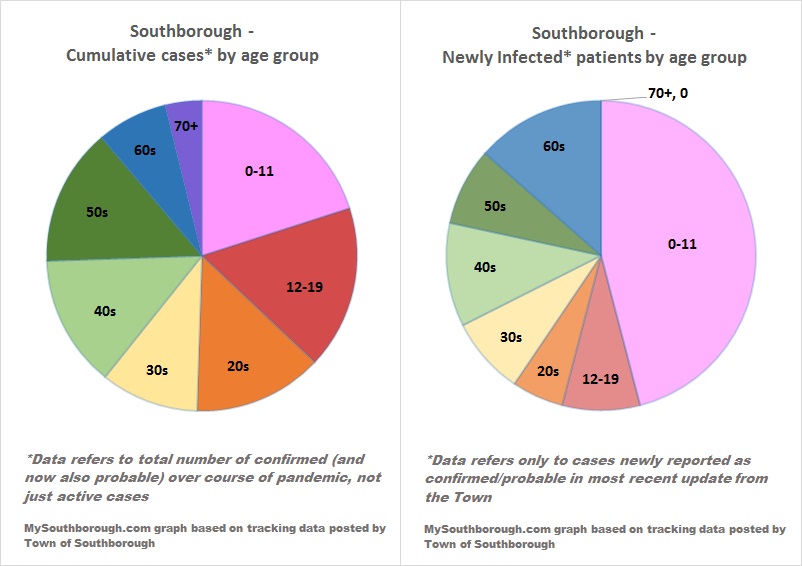
Taking a look again at the age demographics they posted yesterday, I realized that their totals didn’t add up. The 1801 total cases reported should have been 1806. I replaced the first three graphs below to reflect the actual numbers through yesterday. (The six new cases will be included in next week’s update). ]
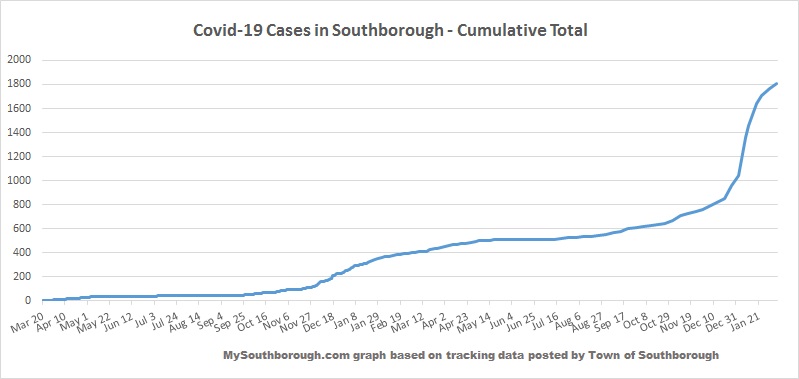
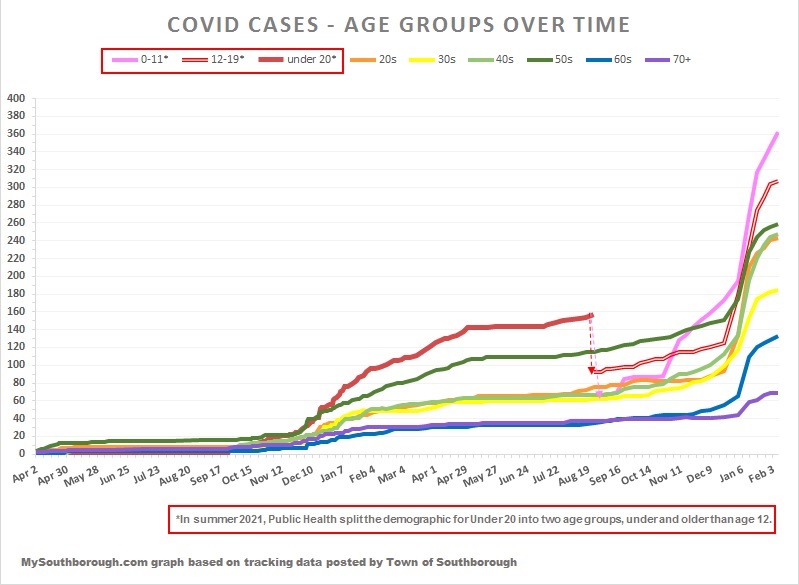
Yesterday, the Town’s updated Covid figures show the lowest number of cases for a week since before Christmas. The total was 32 37 new/probable cases (with 32 labeled active).
That brings the Town’s total cases to 1801 1806. Below are my updated graphs:
![]()
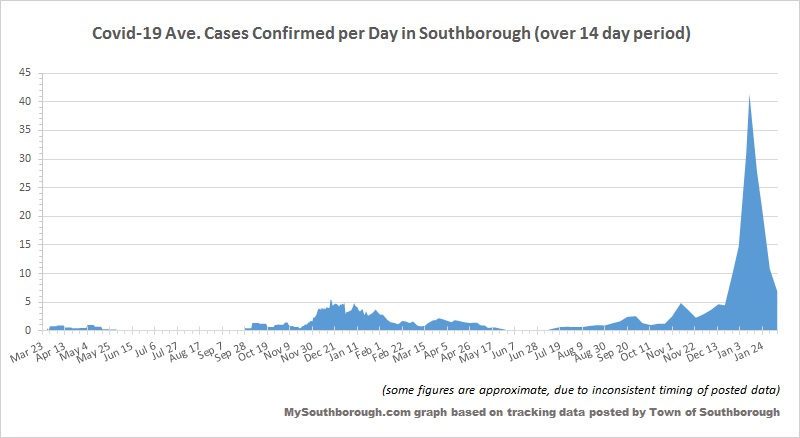
Both the Town and state’s figures show a decline in the average daily incidence rates. The State report from Thursday night also showed a decline in testing positivity rates for the third straight week. (For the latest options for getting tested, see the Town’s page here.)
 For a look at the situation in towns around us, click the image right.
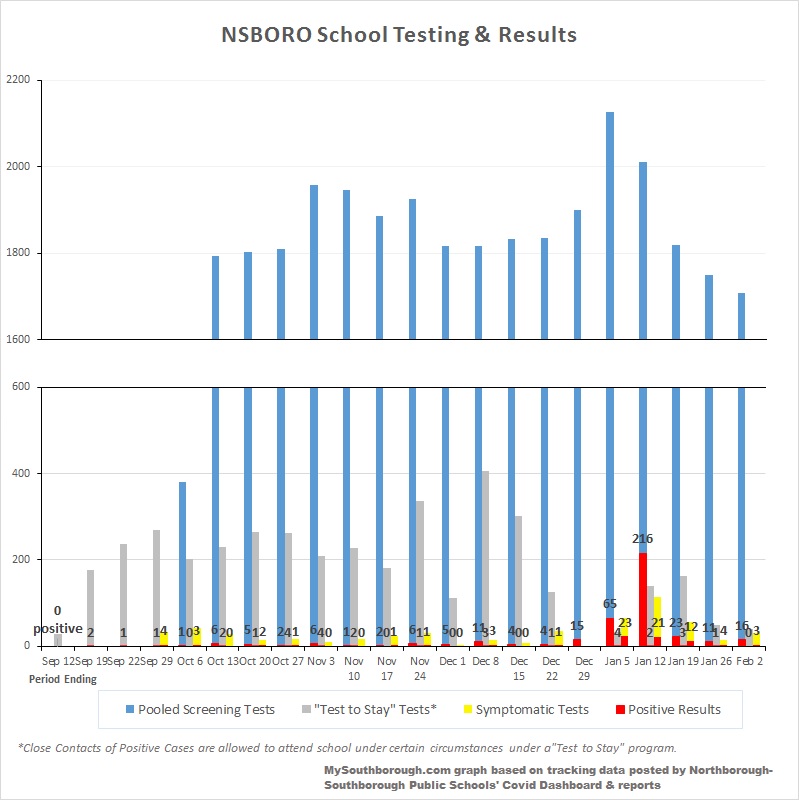
The most recent Northborough-Southborough Public Schools District Dashboard also showed a continued decline in cases.
The Dashboard posted last Thursday covers through Wednesday, February 2nd.
52 cases were reported over the one week, 16 from Southborough K-8 and only 4 from ARHS. Since then, Daily Counts indicate 17 more cases have been confirmed. 16 cases were identified through last week’s pooled screening program.
Below are my updated graphs. (Note, I fixed an error for week of December 29, where I had accidentally flipped Southborough and ARHS figures.)

This week, the District is launching the switch from the Test & Stay model to providing weekly at home tests for students to take on Thursdays, in addition to the pooled screening tests collected on Mondays.
Next week, the Regional School Committee is expecting to hear the administration’s recommendation for a revised Mask policy. The subcommitee on policies is scheduled to discuss that with the Medical Advisory Team this afternoon at 4:00 pm.
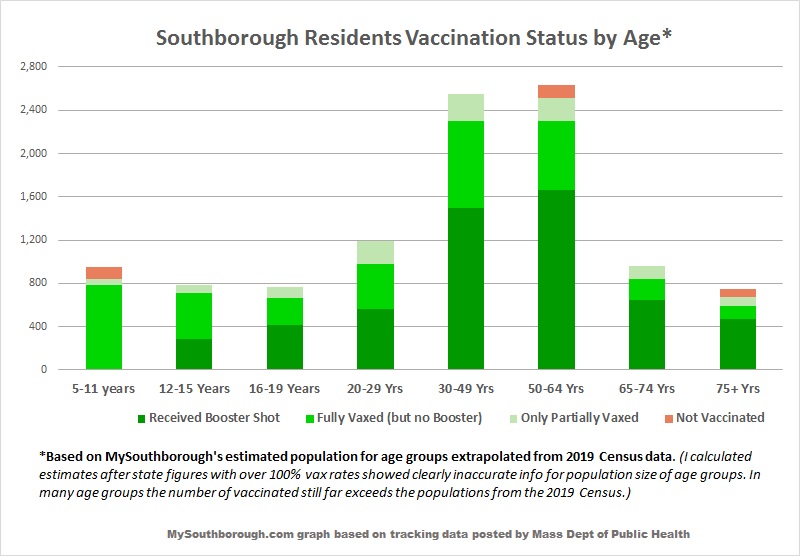
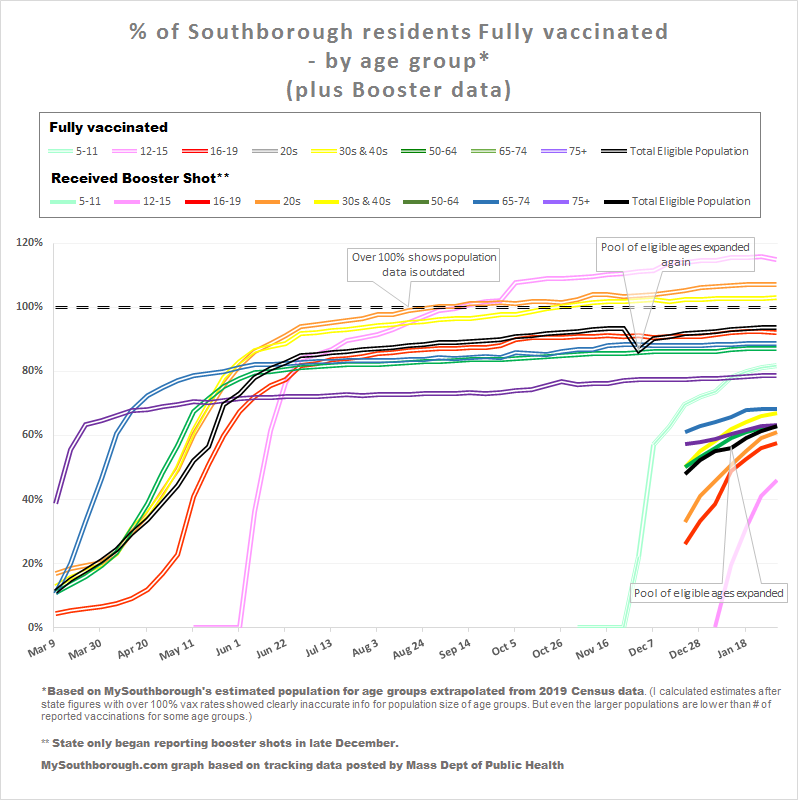
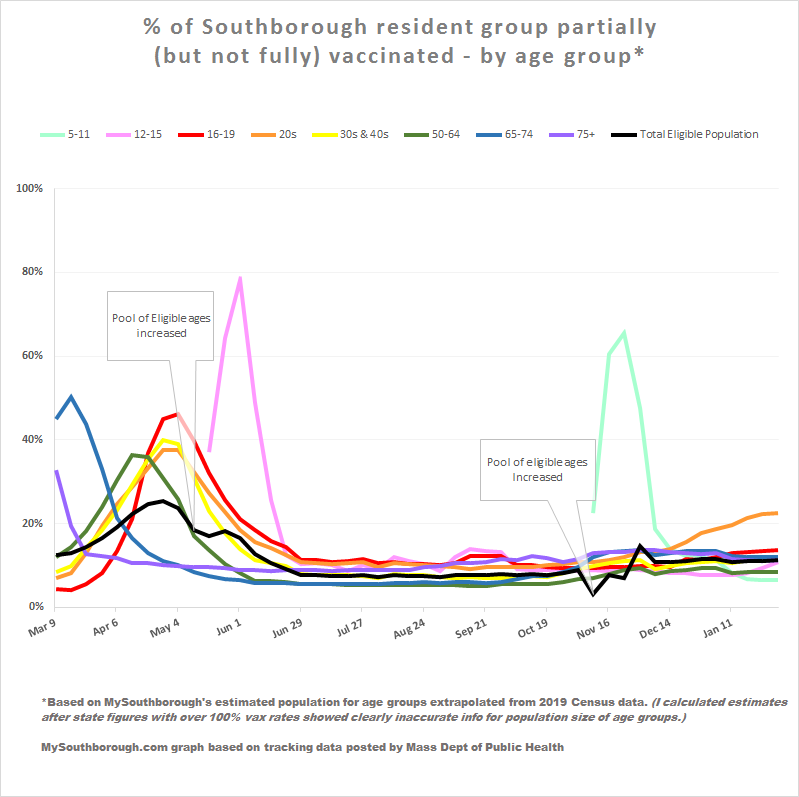
 As for vaccinations, there hasn’t been much movement over the past week. There was a slight increase in the number of residents ages 12+ who received booster shots. That’s now at about 63% as of February 1st.
More highlights by age group and gender are in charts the chart right and graphs below:
(For more details on those groups, plus race/ethnicity, click here.)
To find clinics/locations to receive a Covid Vaccine (including boosters) click here. (If the Town puts on another clinic, I’ll share that info here.)

Its 1809 if you add the numbers up not 1801. Website has been updated I believe.
Actually, it’s 1806. Which means that unless there was an error in the age stats, the total was 5 higher than reported. I saw that myself today when I saw the updated stats on website. An additional 6 cases beyond that were reported this afternoon.
I usually check the total for ages against the total to double check, but forgot this time. I plan to update the post.