![]() It looks like Covid cases in the Town and Southborough schools started to move in the right direction.
It looks like Covid cases in the Town and Southborough schools started to move in the right direction.
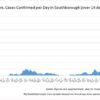
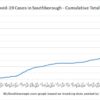
This afternoon, the Town posted it’s weekly data. There were 57 new or probable cases confirmed in one week. That’s down from 71 the prior week and 59 the week prior.
The number of active cases is also down. That’s now listed as 30 (less than half of last week’s figure). More data is in the updated graphs below.
The most recent Northborough-Southborough Public Schools District Dashboard covers through Wednesday, May 18th.
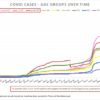
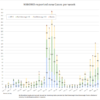
Attendance was down again (at 91.2%) and numbers aren’t low. But the one week count of 110 cases was 25% lower than those reported the prior week. The Dashboard report showed 44 cases were from Southborough K-8, down from 83 the prior week. ARHS’ 24 cases are up from 17 the prior week.
Daily Counts show an additional 55 cases reported in the following five days through this afternoon – 17 from Southborough and 13 from Algonquin.
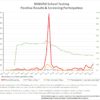
The most recently reported pooled testing screened 25 cases. 7 more were identified through testing symptomatic students/staff. Below are my updated graphs based on the Dashboard data (not including the more recent daily counts).
The State’s weekly report (issued May 19th) didn’t reflect the above trends. But while the report period overlaps the others, it’s based on results from tests taken the two weeks ending Saturday, May 14th.
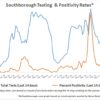
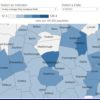
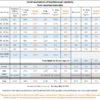
That showed report 116 cases in two weeks with an Average Daily Incidence Rate per 100,000 of 85.7 (an increase for the 7th week). The % of tests confirmed positive was 12.84% (an increase after a slight dip the prior period). Below is my tracking of the testing & positivity rates and a regional map of the most recent incidence rates.
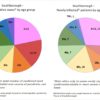
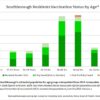
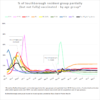
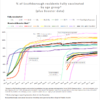
I took a look at the updated vaccination stats in Southborough. There hasn’t been much movement over the past month. (Though the state didn’t post figures identifying “2nd boosters”, while the Town held a clinic for those last week.) Below are my updated chart and graphs:

