
Before I get into the latest stats, reminder that this Thursday there’s a Covid Vaccine clinic for anyone ages 5 through adults that needs a booster shot (first or second). Check out those details here.
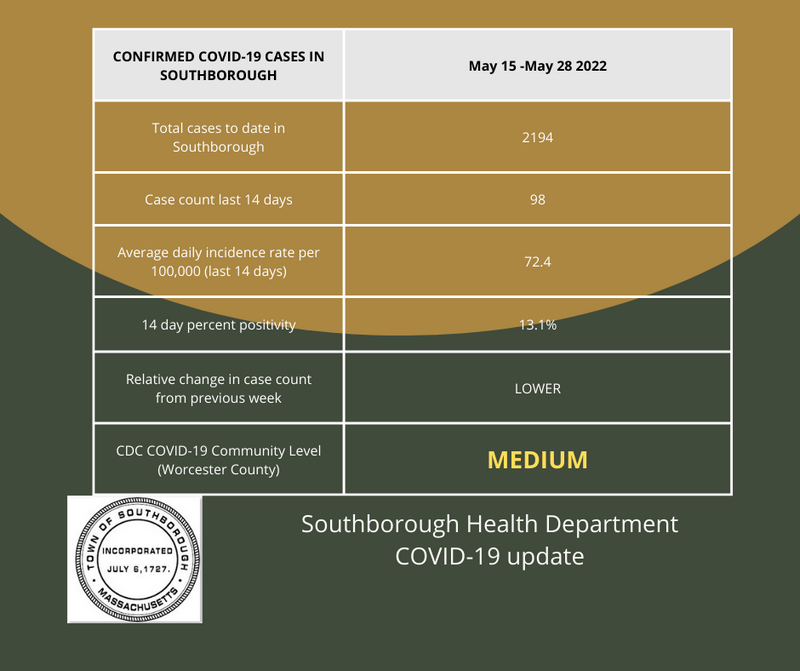 In Southborough cases, the Public Health Department announced a shift last week. Instead of sharing details on case counts, active cases and ages, they are shifting to simply sharing stats from the state’s weekly report.
It’s worth noting that as of last week, the state was reporting about 130 fewer cumulative cases for our Town than Southborough’s Public Health Department. I reached out to understand the discrepancy.
Public Health Nurse Taylor West reminded that over the winter, Southborough began including in their weekly counts the “probable” cases confirmed through antigen tests conducted at urgent care facilities. That was approved by the state based on the difficulty residents had accessing PCR tests. However, the state didn’t make that change in their own reporting. They only account for the PCR tests.
Yet even the Town’s lower figures are much lower than actual case counts in town. The Health Department isn’t able to capture the positive cases confirmed by at-home tests, even if reported to primary care physicians. Recently, the Town determined that 85% of cases that were reported to Southborough public schools didn’t show up in the Town’s Public Health reports.
As for the recent surge in the schools, that already passed. (Fingers crossed we don’t see another before school is out.) Last week’s Dashboard for NSBORO Schools through Wednesday showed a sharper decline than the prior week in new cases reported, especially in Southborough. (Southborough schools had only 8 cases vs 27 the prior week. Algonquin had 16, about the same as the prior week.)
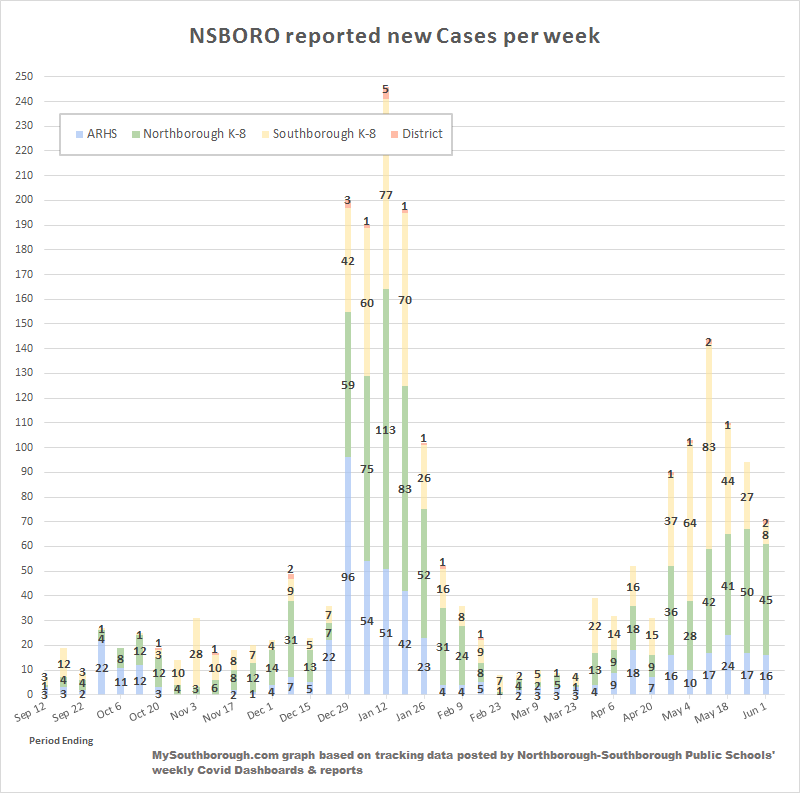
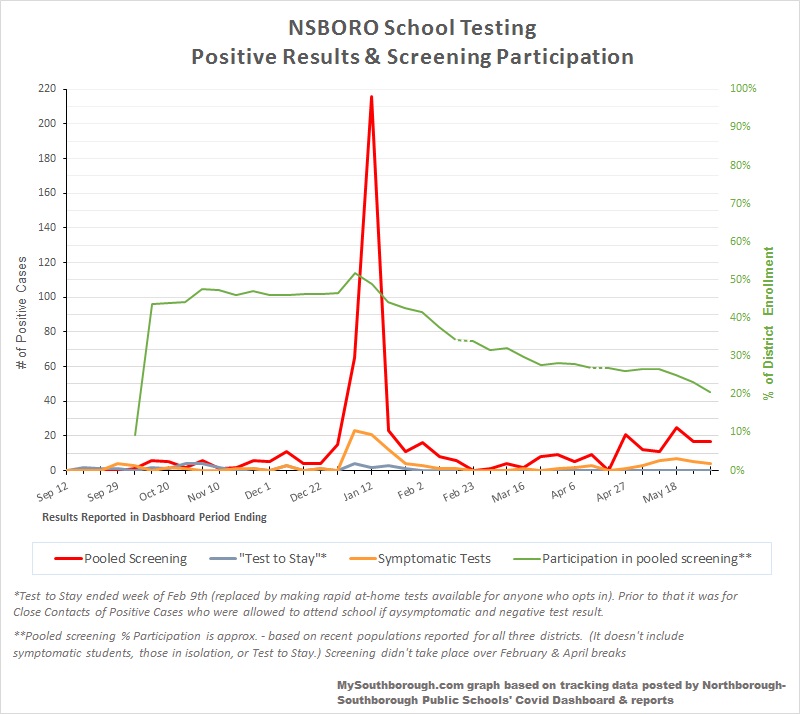
For the three combined districts, 17 cases were screened by the pool testing and 4 identified through testing symptomatic students/teachers.
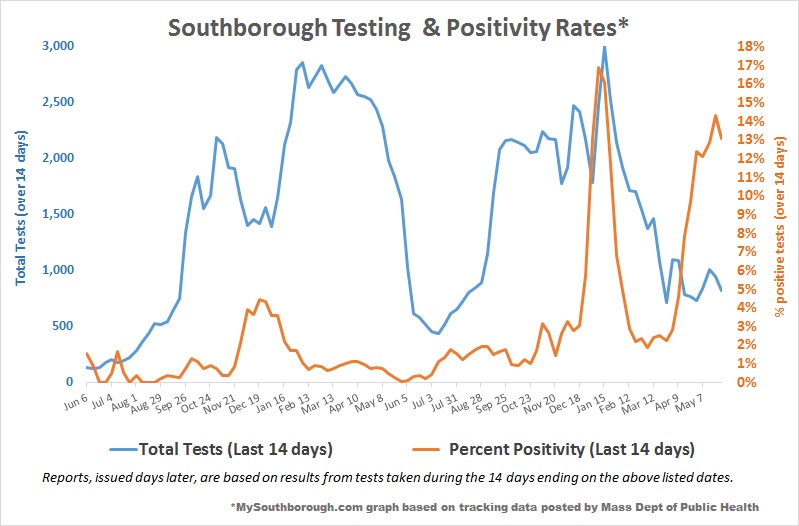
The latest data on Southborough’s PCR testing reported by the state is below. It shows that positivity rates are down. (The regional map still shows our positivity rate higher than most surrounding communities.)

The most helpful data for what’s happening with Covid in a community is hospitalization rates. That’s why the CDC has been using those to determine the community level risk. But that’s only by County, and those are based the location of hospitals, not where patients reside. (And, obviously, we don’t have any hospitals of our own.)
Last week, the CDC lowered the risk for our county, Worcester County, from high to medium. But, Southborough is bordered on three sides by Middlesex County which covers both the Framingham and Marlborough hospitals. That county is still designated High.
The good news is the hospitalization rates for that county have been coming down. Plus, the West told me that MWRA’s wastewater data (which includes Framingham and Ashland) is promising. (Since Southborough is septic system based, we don’t have town specific stats.)
Below are my updated graphs on Town cases per week and average daily incidents based on the state stats rather than the Town’s data.


(I considered no longer posting the graphs, since they only represent a percentage of the positive cases. But it still seems to be a useful baseline to see if cases are trending up or down.)