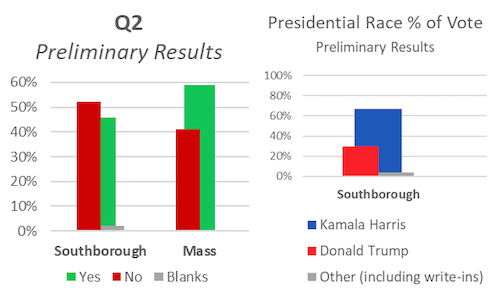
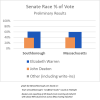
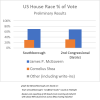
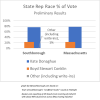
Above: A look at how residents voted in the big 2024 election, including comparisons where voters’ will was thwarted by national/state/regional results. (graphs created by Beth Melo)
Southborough’s unofficial results* from yesterday’s election were issued at midnight. I took time today to hash through the data and compare it to the state’s and districtwide results.
Here are the highlights of how Southborough voted versus the state.
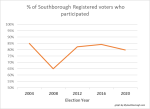 Turnout was down this year from 2020 by 5.2% percent.** 79.8% of registered Southborough voters participated. It’s also lower than participation rates in 2004, 2008, and 2016. (Only in 2012 was the turnout significantly lower, at 65%).
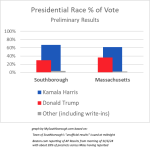 Presidential Race: Based on the results, even more Southborough voters are unhappy about former President Trump’s big win than the average Mass resident. 67% of voters in our town supported Kamala Harris, versus 30% pro-Trump, and only 4% chose a third party or wrote someone in.
In other races: Residents overwhelmingly, and successfully, supported Democratic incumbents over independent challengers. We will continue to be represented by U.S. Senator Elizabeth Warren, U.S. Representative James McGovern, and State Representative Kate Donaghue. Below is how they fared in town compared to the overall races:
Ballot Initiatives: With one exception, Southborough voters, again, supported the status quo over big change. And their will was only thwarted on two of the ballot questions.
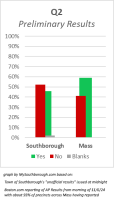 Q2 seeks to eliminate the MCAS graduation requirement. In Southborough, it was the question that had the highest participation rate. (Only 2% of voters left it blank.) Of those who voted on it, 53.2% said NO to changing statewide graduation requirements contingent on passing the exams. That contrasted with 59% of state voters chose to eliminate the standard by voting YES.
Q3 had a slightly lower participation, with 4.6% leaving it blank. Those who did vote showed our town to be less union-friendly than residents across the state.
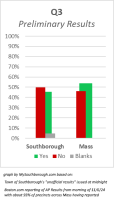 53.2% of the Southborough votes opposed a change to allow gig drivers to unionize. Statewide, 54% approved allowing drivers the option to organize.
On the other questions, Southborough was pretty much inline with the rest of the state.
That included the one question that Southborough voters agreed a change is needed on — Q1 to allow the auditor to audit the legislature. 66% of Southborough votes were for Yes, in keeping with, but not quite as enthusiastic as the 72% statewide approval.
The legislature has claimed the power would exceed her authority. So don’t be surprised if it gets challenged in court.
On Q4, proponents failed to pass the ballot for access to psychadelics. Southborough voters were even more conservative than the overall state, opposing it by 62% versus 57%.
On Q5, Southborough and the state had pretty much the same result, opposing the proposed change to the tipped minimum wage by 64%.
For the Town’s full unofficial results, click here.
*With results yet to be audited, and mail-in ballots potentially still on their way in, these are just preliminary figures. But no big vote shifts are expected as a result.
**The number of registered voters in town has increased since 2020. But even just the number of participating voters was down this year by 4.9%.

