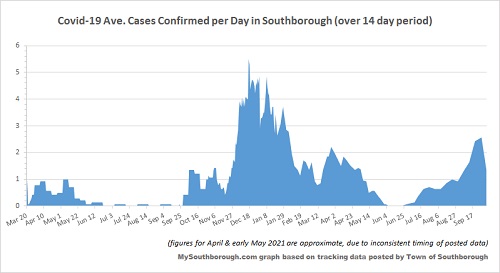
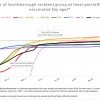
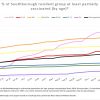
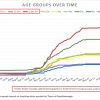
Above: The two week infection rate in Southborough has gone down. (Click graph to enlarge)
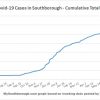
As of this morning, the Southborough Board of Health is showing 7 residents in isolation for active cases of Covid-19. The total cases over the course of the pandemic is now 619. That’s 8 cases in six days and 19 in two weeks.
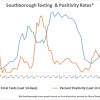
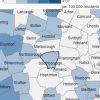
Last week’s report from Mass Dept of Public Health (issued September 30th)* indicated 33 cases in two weeks with the % of tests confirmed positive as 1.76% (<0.10% difference from prior report). The Average Daily Incidence Rate per 100,000 was 24.4 (higher than prior period).
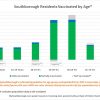
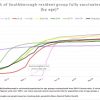
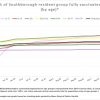
For details, including a look at the Average Daily Incidence Rates in our region, click on thumbnails below:
![]()
As I’ve previously shared, the Town is partnering with Ashland to hold a drive thru testing clinic. Click here for those details. (The schools will also be offering tests for students. Scroll down for those details.)
Today, the Town also announced that it will be offering a booster vaccine clinic for seniors 65 years and older that meet certain criteria. (Look for another post this afternoon with those details.)
As of the latest state report, 8,634 Southborough residents had received shots by September 28th.
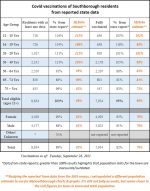 My data indicates 90% of residents old enough to be eligible for shots are fully vaccinated, and another 8% are partially vaxxed.** (To find options for getting vaccinated, click here.)
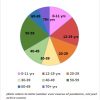
More highlights by age group and gender are in the chart above right and graphs below:
(For more details on those groups, plus race/ethnicity, click here.)
Last week, Algonquin Regional High School launched its screening program for students. On Friday, the Northborough Southborough Schools Superintendent Gregory Martineau announced that screening will be expanded to include the lower schools this week. Parents do have to submit consent forms for students to participate. (You can find details here.)
The email also stated that going forward, parents would no longer receive emails about new cases in their schools. Instead, the weekly District Dashboard will be updated daily to list new cases. A reader pointed out that what looks like a header at the top of the Dashboard is the link for finding the Daily new cases. As of this afternoon, the ” DAILY POSITIVE CASE COUNT” link opened a document showing data for October 1st.
*The state’s report was based on tests taken in the 14 day period ending on the prior Saturday.
**Population figures are just estimates. I use demographics extrapolated from 2019 census data since the state’s population data was clearly outdated.
Updated (10/4/21 2:11)
Updated (10/4/21 3:15) I learned that a link in the District Dashboard pulls up the daily stats.

