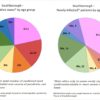
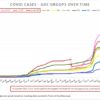
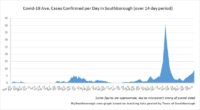
 This morning, the Town posted it’s weekly updated Covid figures. As of this morning, there were 71 new or probable cases confirmed in one week, 130 in 2 weeks. [Somehow, I had a strange typo there. We never came close to “1199 in 2 weeks” – which would have been astronomically beyond any record – not just “The number of cases per day over two weeks is at its highest since January.”!]**
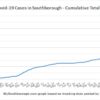
The Town’s cumulative total over the course of the pandemic is 2223 cases with 66 cases labeled active.
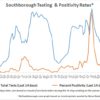
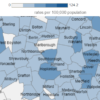
The State’s weekly report (issued May 12th), based on overlapping data*, indicated 95 cases in two weeks with an Average Daily Incidence Rate per 100,000 of 70.2 (an increase from the prior week). The % of tests confirmed positive was 12.10% (slight decrease after 5 weeks of rising rates). Below is my tracking of the testing & positivity rates and a regional map of the most recent incidence rates.
NSBORO Numbers
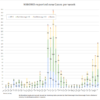 The most recent Northborough-Southborough Public Schools District Dashboard covers through Wednesday, May 11th. In one week, 144 cases were reported – 83 from Southborough K-8 and 17 from ARHS. Attendance was down to 91.7%. (An alert from the Superintendent notified families that masks were recommended for the remainder of last week , but not required.)
Daily Counts show an 26 additional cases reported the following two days through Friday, May 13th – 11 from Southborough and 6 from Algonquin.
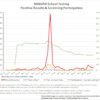 The most recently reported pooled testing screened only 11 cases. 6 more were identified through testing symptomatic students/staff.
*The Mass DPH reports are issued Thursday evenings are based on results from tests taken during the 14 day period ending the prior Saturday.
Updated (5/18/22 1:26 pm): I had a strange typo in my reporting of two week Covid figures. As I note above, we never came close to 1199 in two weeks. That would have been astronomically beyond any record! The correct figure was 130 cases in two weeks.
As I initially wrote, the number of cases per day over two weeks is at its highest since January. It’s currently an average of 9.3 cases per day over two weeks. The peak figure in mid-January was 41.4 per day. That fell to 10.8 at the end of January.

